Give your assistant
the numbers.
Get a chart worth sharing. Describe the question, share the data and ask for the view you need.
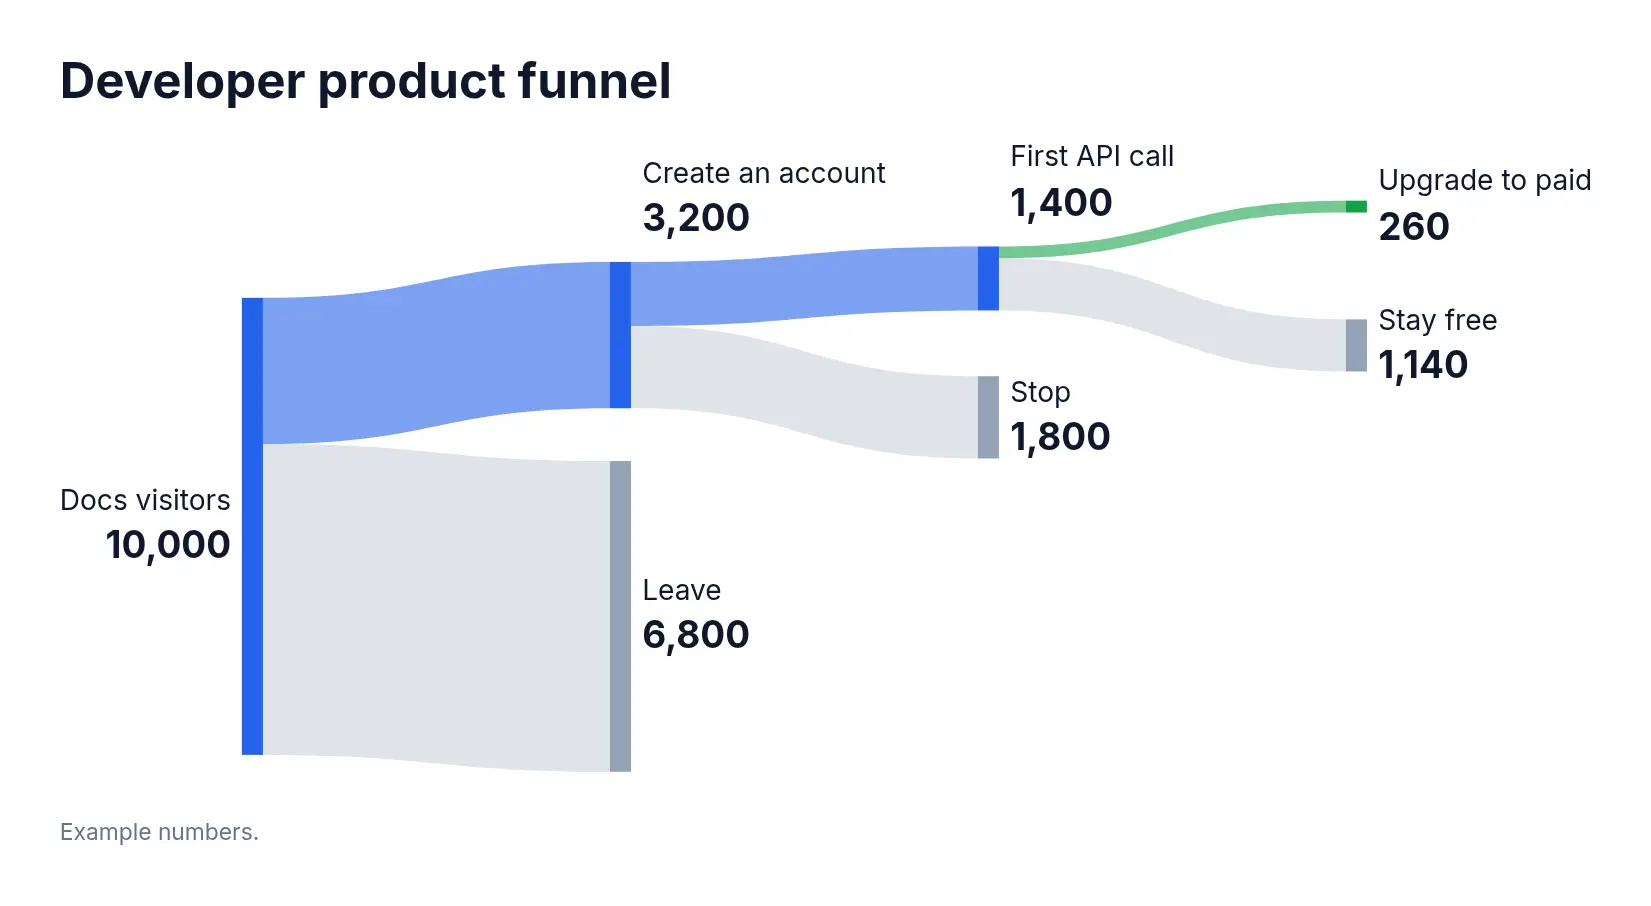
A Sankey diagram of our developer funnel: 10,000 docs visitors; 3,200 create an account; 1,400 make a first API call; 260 upgrade to a paid plan.
What do you want to understand?
Costs, performance and traffic, shown with illustrative data.
Break down the bill.
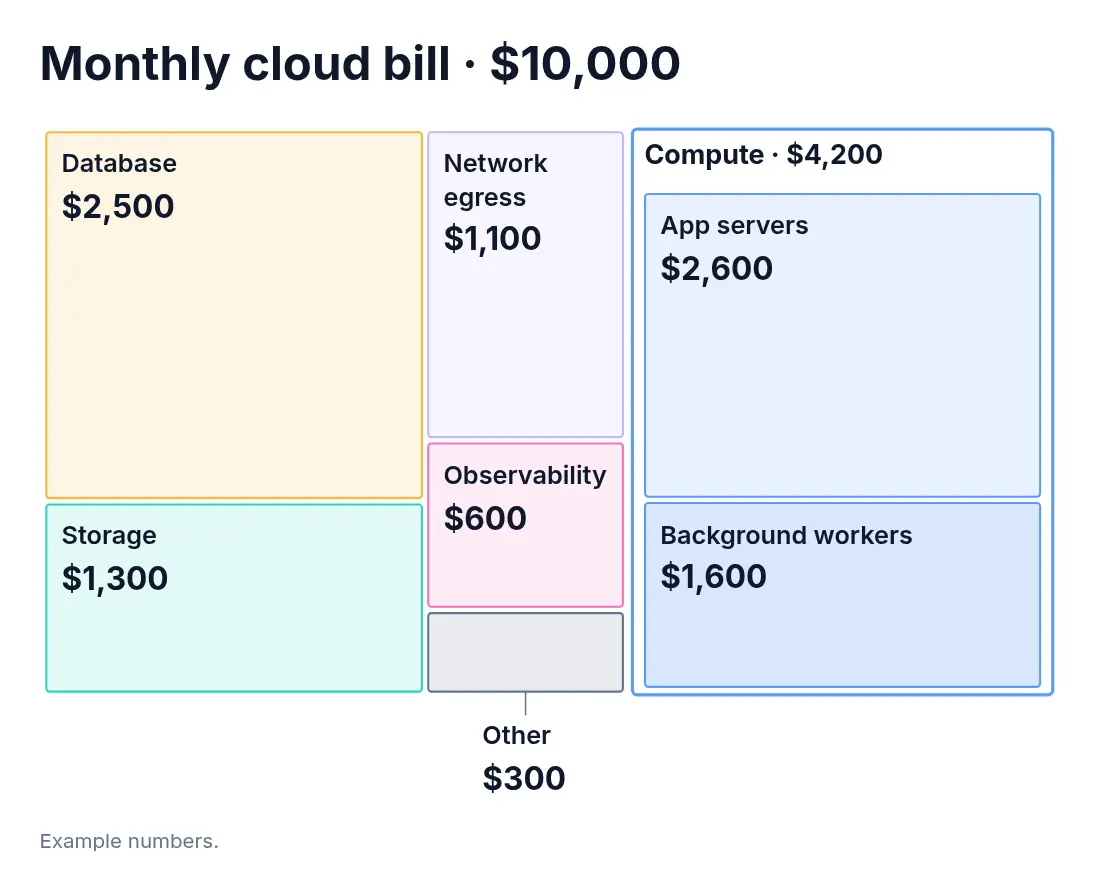
Show the share of each cost, with app servers and background workers grouped under compute.
Where our $10,000 monthly cloud bill goes: compute $4,200 (app servers $2,600 and background workers $1,600), database $2,500, storage $1,300, network egress $1,100, observability $600, other $300.
Compare the whole range.
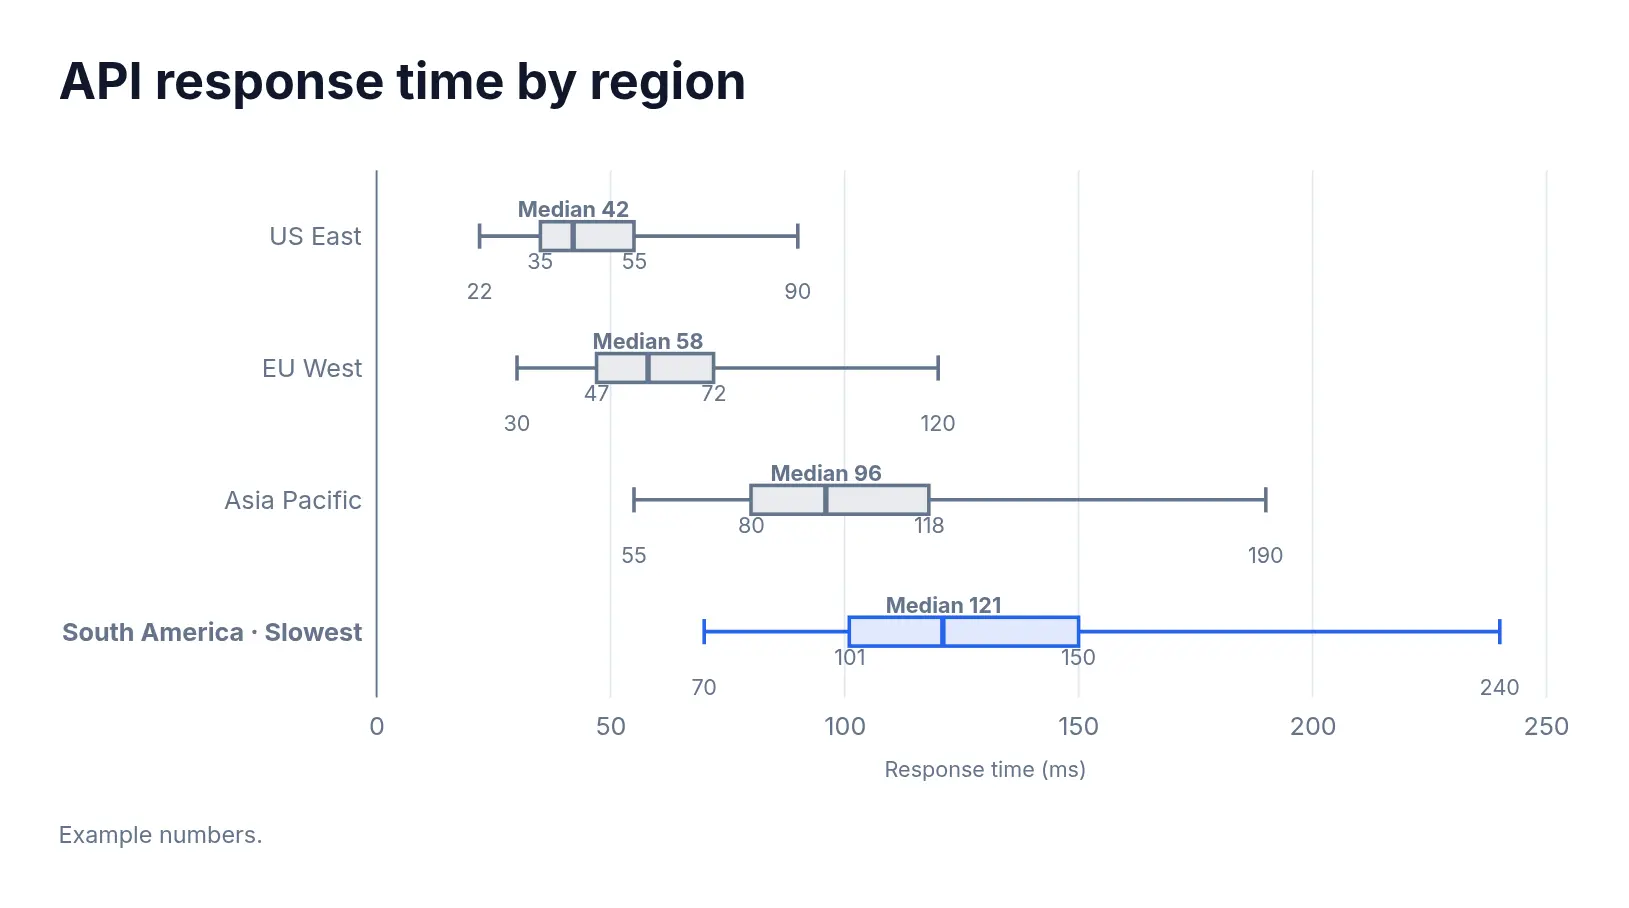
Compare medians, spread and extremes across regions. A box plot keeps all three visible.
Box plots of API latency in ms (min / Q1 / median / Q3 / max): US East 22 / 35 / 42 / 55 / 90; EU West 30 / 47 / 58 / 72 / 120; Asia Pacific 55 / 80 / 96 / 118 / 190; South America 70 / 101 / 121 / 150 / 240.
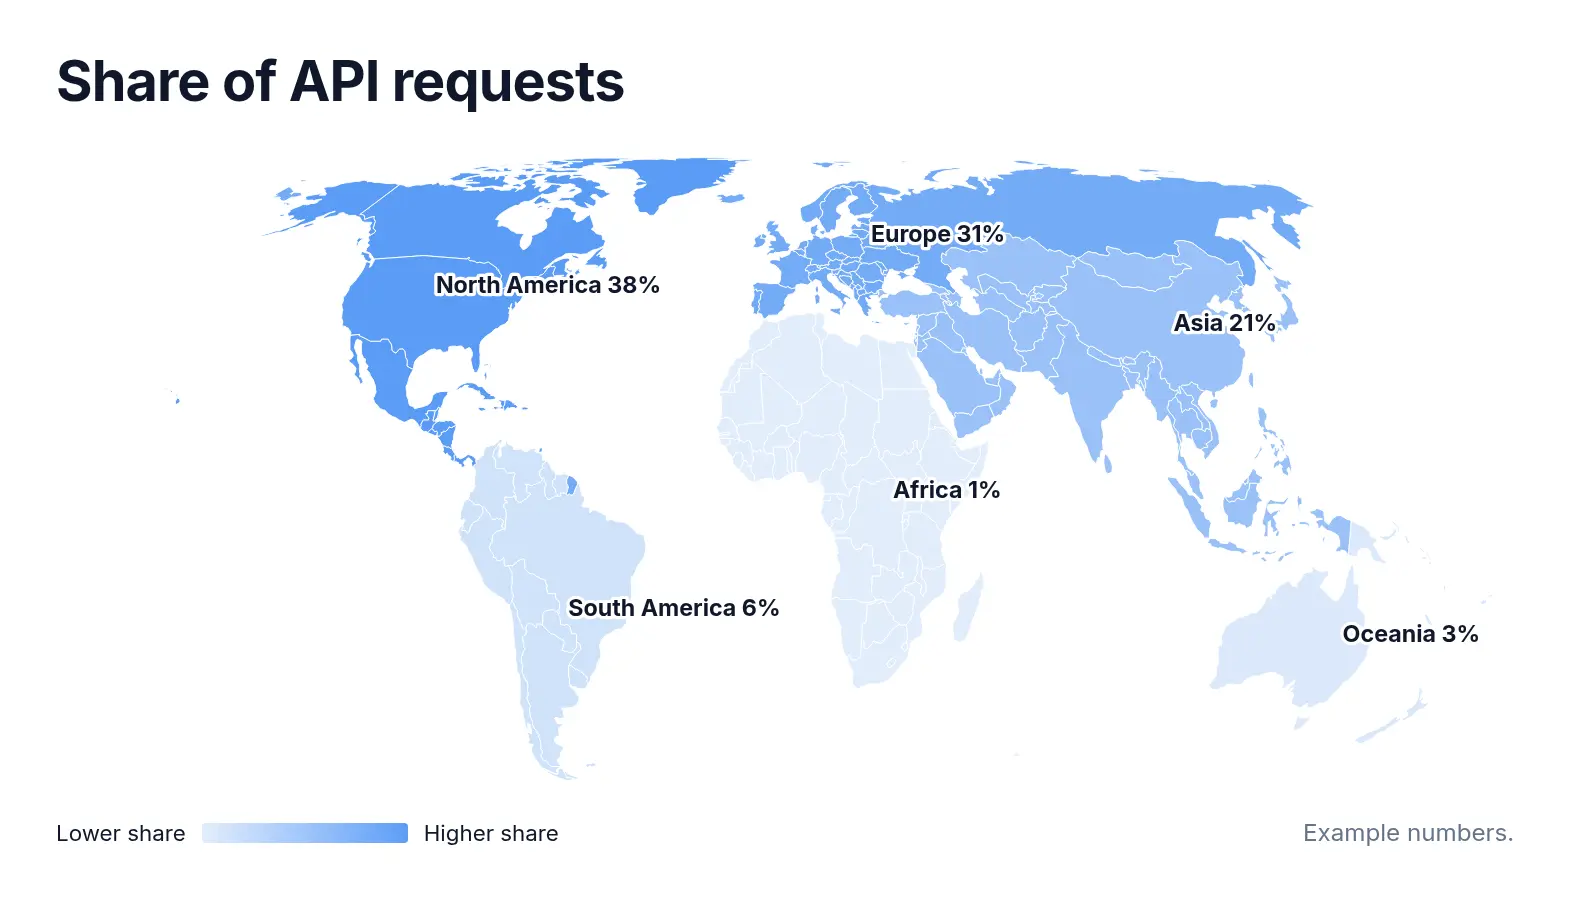
See where requests come from.
Put regional traffic on a map, with labels showing each region’s share.
A world map shaded by share of API requests: North America 38%, Europe 31%, Asia 21%, South America 6%, Oceania 3%, Africa 1%.
Ask for the detail that matters.
Keep working in the same conversation. Ask for an annotation, a different comparison or updated numbers.
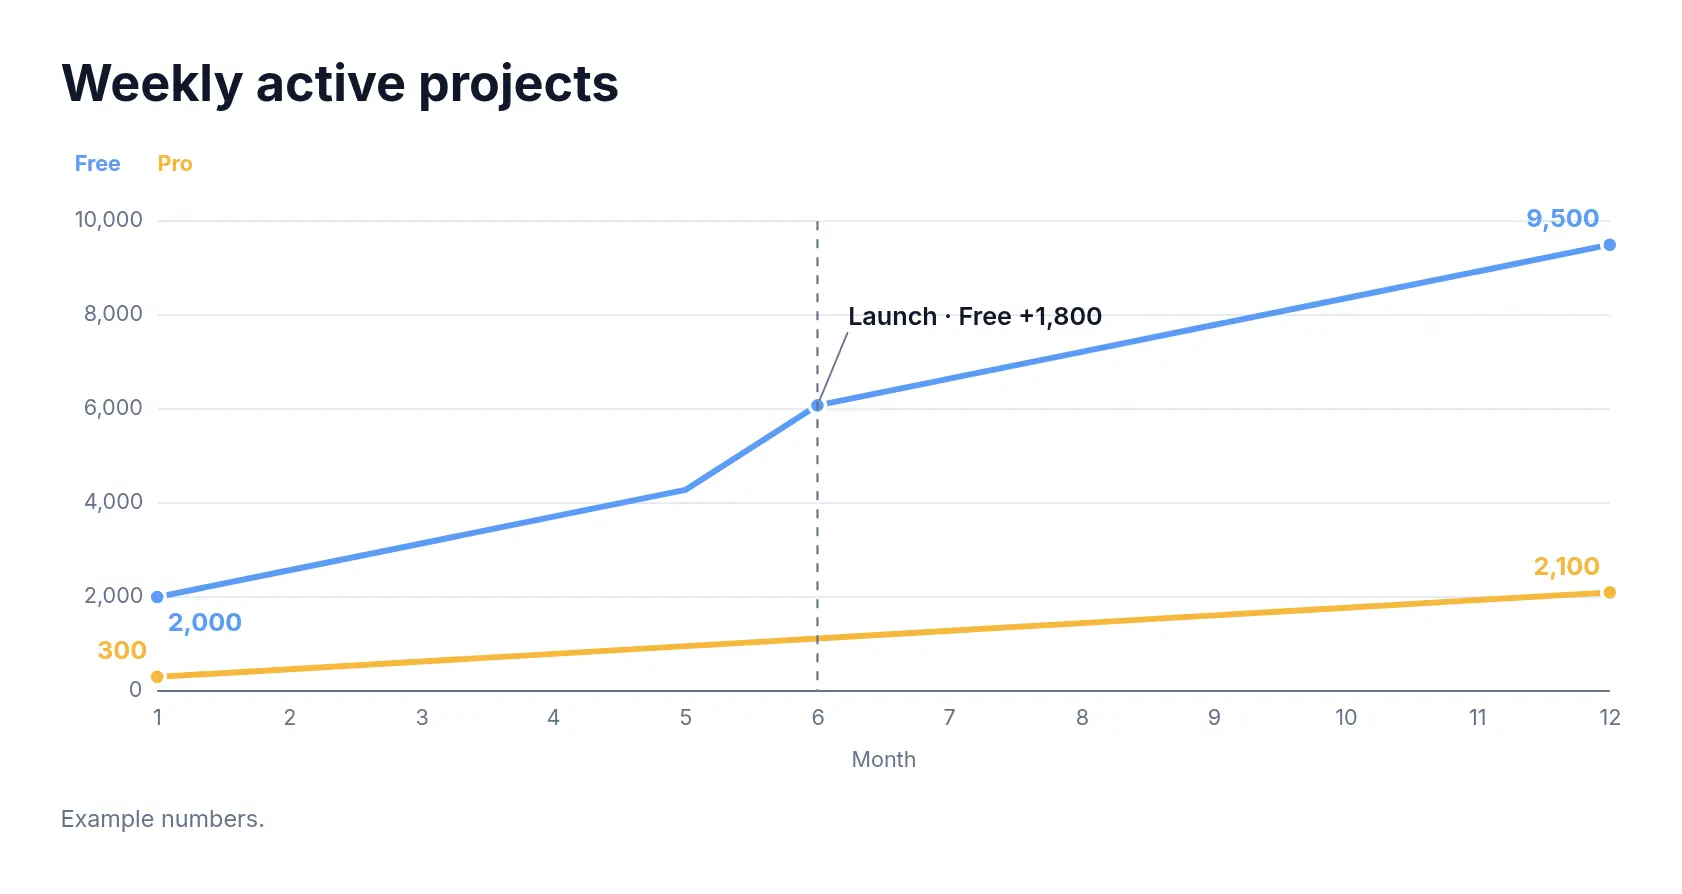
Mark the month 6 launch on the weekly active projects chart.